
MyFranchiseAnalytics

A walk through your four walls

You can only walk one store at a time. Your numbers walk all of them.

Scroll from the parking lot to the back office. At every stop, the one number a sharp operator would check — food cost against theoretical, hours against the sales you actually did, the expense line that moved three weeks ago.

Built for operators running 20 to 150 restaurants

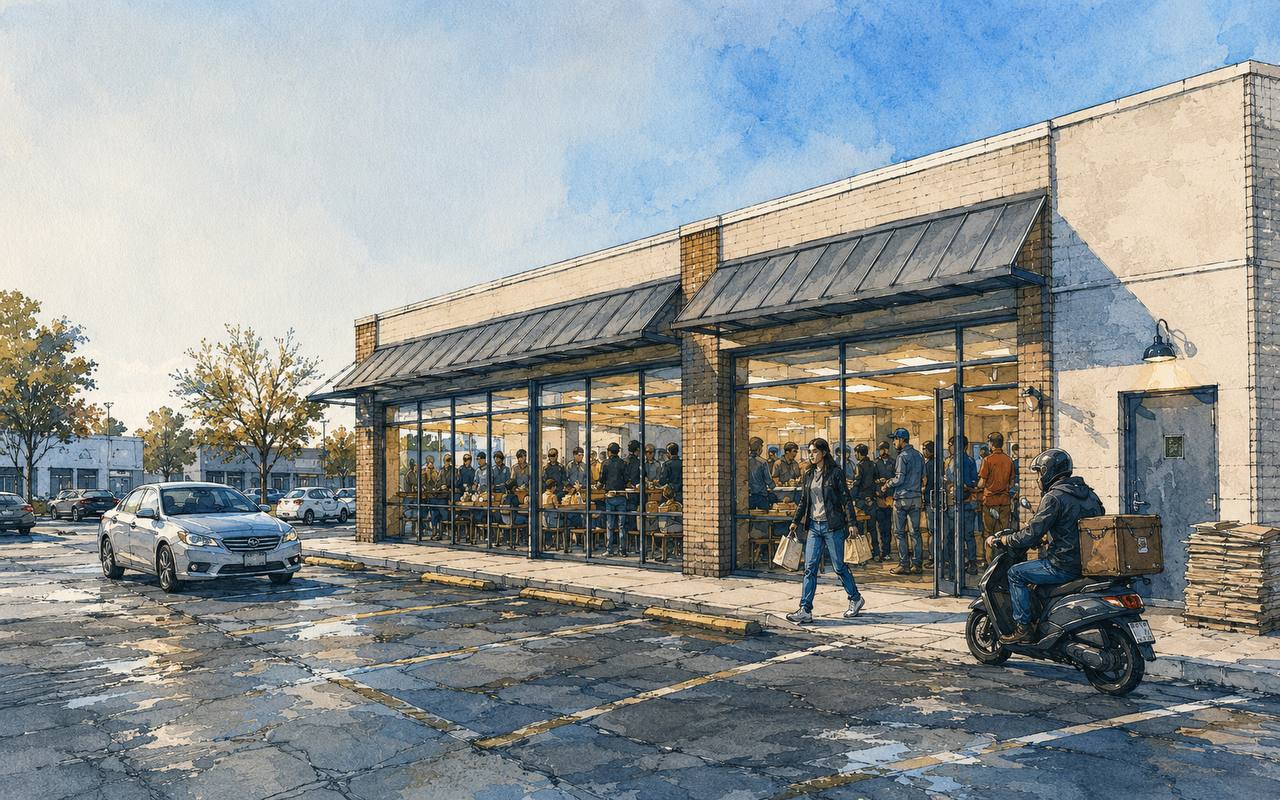
A busy sandwich shop seen from the parking lot, guests visible through the glass and a delivery scooter at the kerb.

Labor vs sales

31.4%

4.1 pts over plan · unflagged 3 weeks

Scene 00 — the sidewalk

A walk through your four walls, in five stops

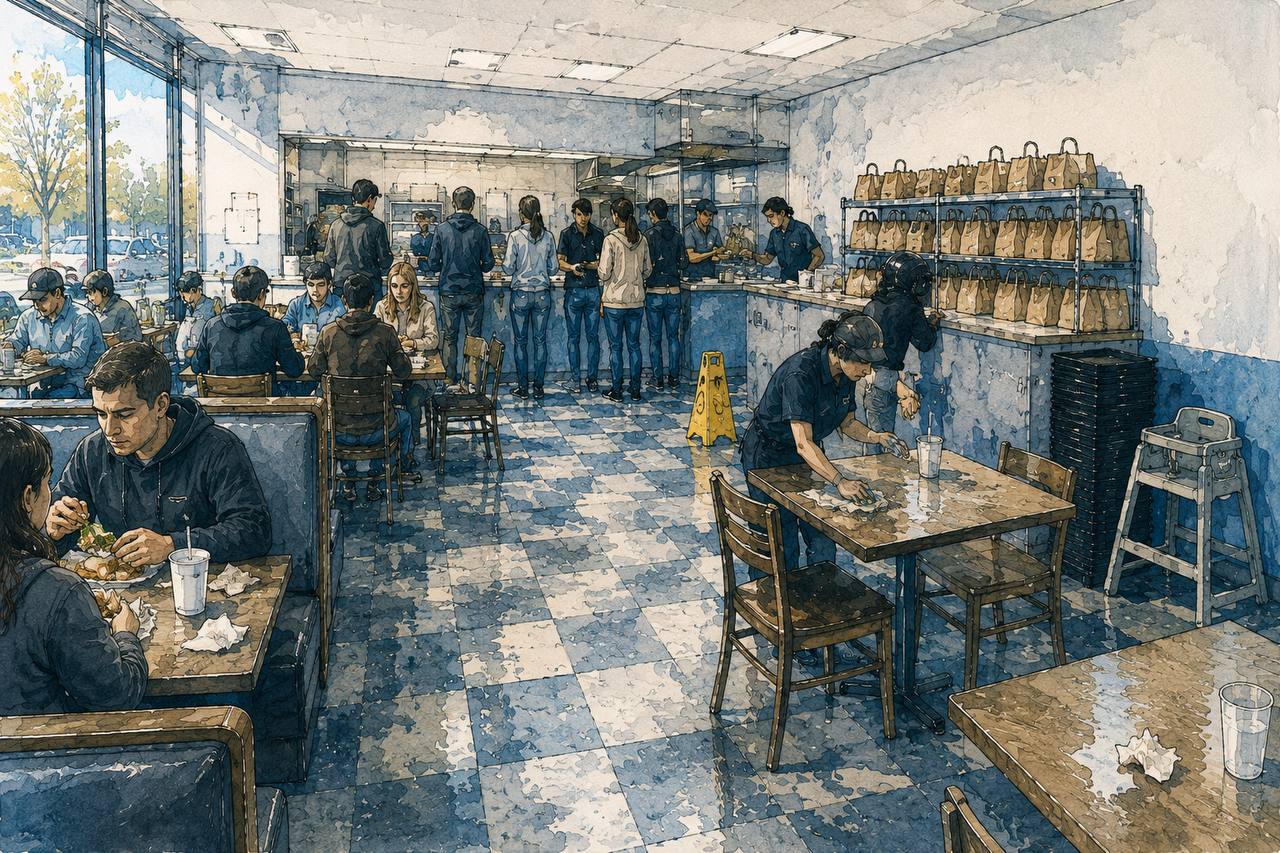
The dining room at lunch: tables full, a queue at the counter, and delivery bags stacked on the pickup shelf. 01 · Dining room
1 Lunch daypart 61% of the day 11:15 to 1:45
2 Pickup shelf 214 delivery orders Counted apart from in-store
3 Forecast vs actual 2.1% under Trailing four weeks

Stop 01 — Dining room

What came in, where it came from, and what comes next

Register, tablets and tables tell three different stories, and adding them together loses all three. We keep them apart, and put next week's number up before the schedule is written.

  • Transactions and average check split by daypart, store by store
  • Delivery orders held apart from in-store, so channel mix stays honest
  • A learned forecast published Thursday, then scored against what happened

What it changesNext week gets staffed on next week's volume, not last week's.

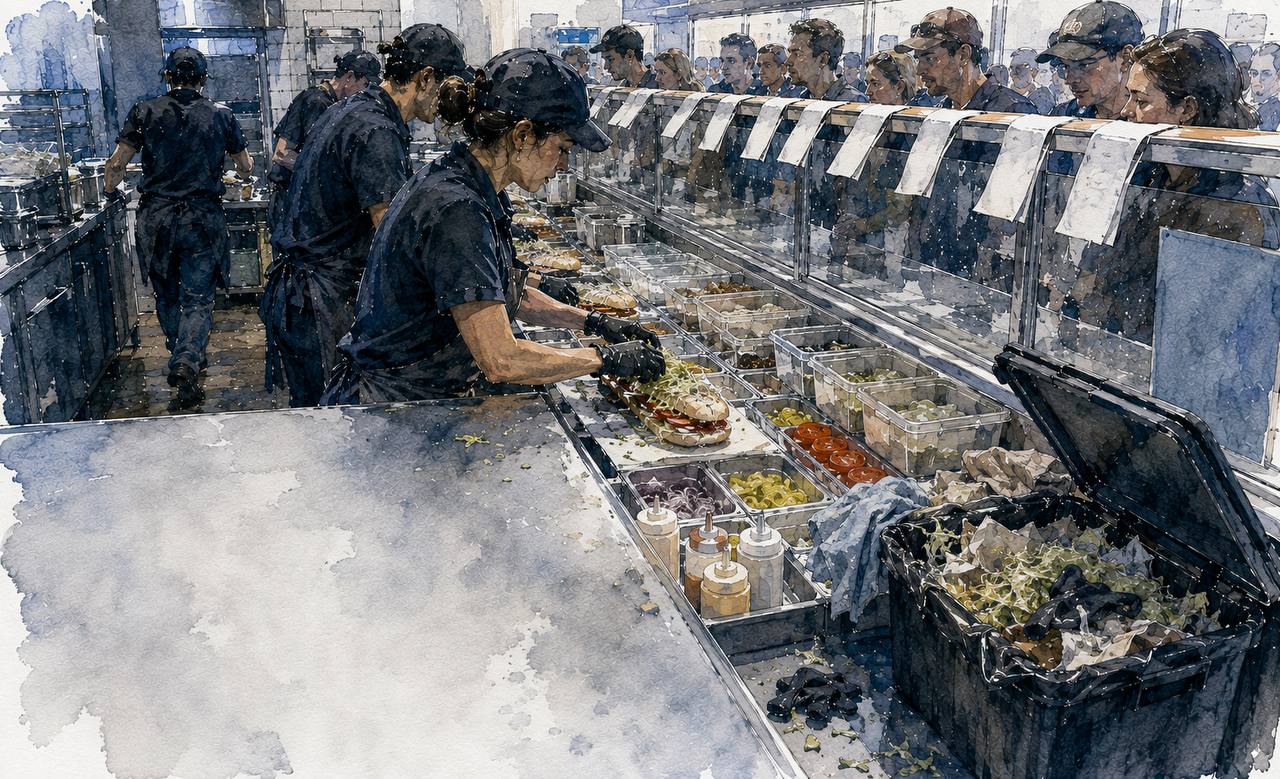
The make line mid-rush, crew working shoulder to shoulder with tickets on the rail. 02 · The line
1 11:30 rush Needs 5, scheduled 4 From this store's own curve
2 Overtime drift 6.2 hrs a week Flagged Wednesday, not Friday
3 Cut time 2:15 to 1:45 36 hours back a week

Stop 02 — The line

Four on at noon when the curve says six

We build the labor need half-hour by half-hour from the store's own sales curve, lay the posted schedule over it, and show the gaps both ways — short at the peak, long after it.

  • Half-hour labor need per store, not one target for the whole group
  • Scheduled hours against earned hours, by store and by week
  • Overtime surfaced mid-week, while someone can still act on it

What it changesCuts happen at the right hour instead of the convenient one.

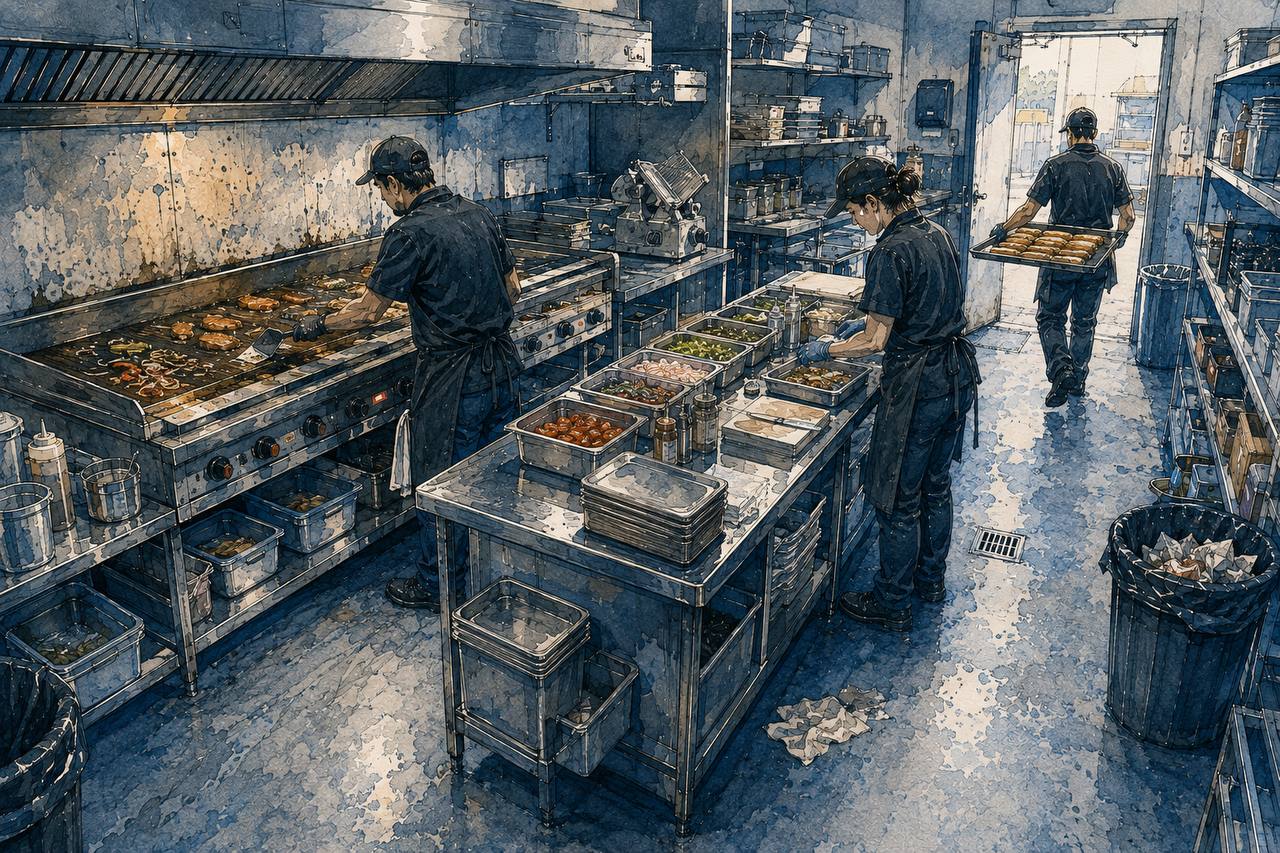
The back kitchen and prep area, a cook at the grill and product being portioned. 03 · Kitchen
1 Actual vs theoretical 1.8 points over Six-period trend
2 Portion drift A quarter ounce Roughly $14K a year
3 Waste log 3 of 12 logging daily Discipline, visible by store

Stop 03 — Kitchen

The slicer setting nobody changed back

We run actual against theoretical by store and period, then break the gap out item by item. You end up talking about how thick the turkey is cut, not about food cost.

  • Actual versus theoretical by store, period, and item
  • Portion and prep variance named at the item level
  • Waste and discount leakage separated from true product cost

What it changesYou coach the one station that is off, not all twelve stores.

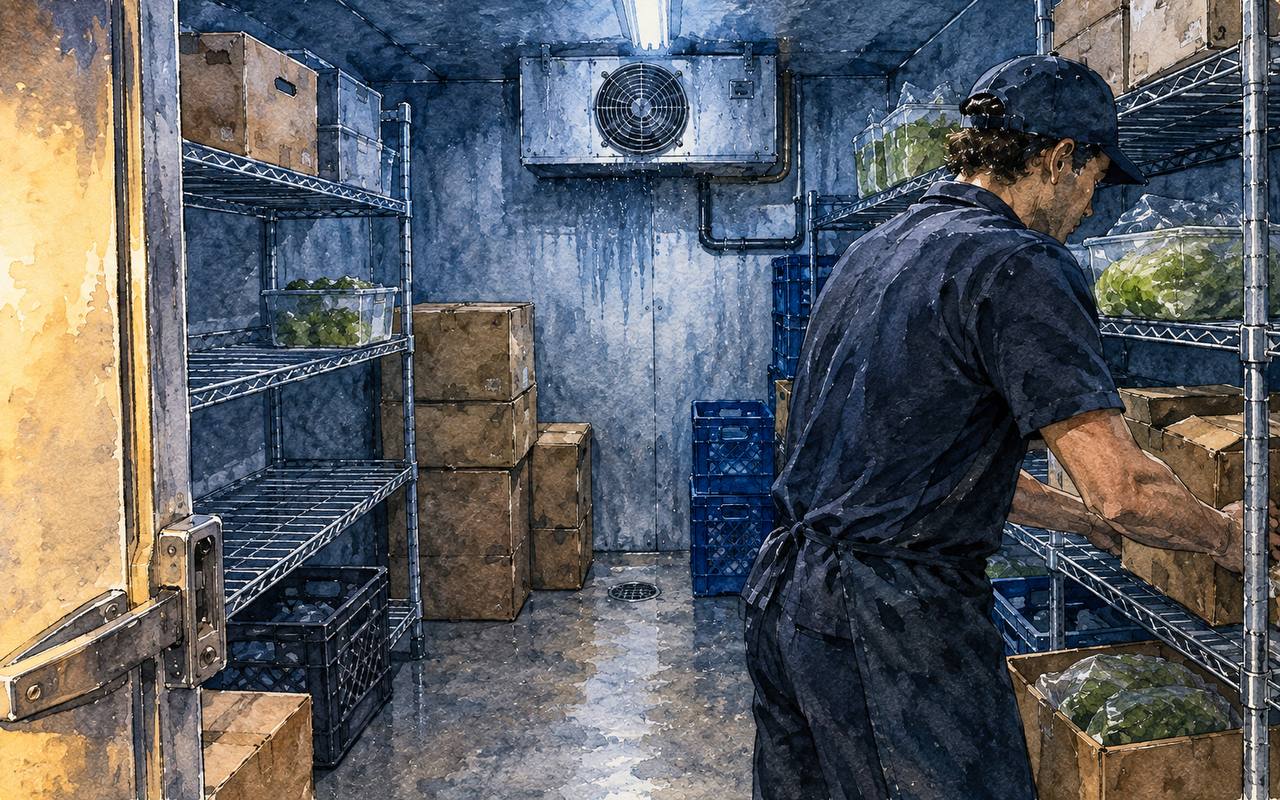
Inside the walk-in cooler, cases on the shelves and the compressor unit on the back wall. 04 · Walk-in
1 Compressor Runtime up 38% Fourteen days, third call
2 Counts 6 missed this period Which store, which night
3 Product at risk About $3,000 On hand behind that door

Stop 04 — Walk-in

What is on the shelf, and what has been fixed three times

Shelf counts against what the recipes should have used, and beside them the repair history of the cooler, work order by work order, including the one that has been out three times this year.

  • Counts, on-hand value, and usage against theoretical
  • Work orders and cost per asset, per store, over its life
  • Repeat repairs flagged, so you replace instead of patching again

What it changesThe unit gets replaced on a Tuesday instead of quitting on a Saturday.

A cramped back office late in the evening, invoices spilling from a tray under a desk lamp. 05 · Back office
1 Consolidated P&L Every store, every period Fourteen lines to EBITDA
2 Expense outlier $2,140 above pattern Versus trailing six periods
3 Period review pack Sent, not requested One PDF per store, per DM

Stop 05 — Back office

The whole walk, in fourteen lines

One statement for the whole group, period over period, with the numbers that do not fit already circled. The director packs are emailed automatically, so nobody spends Monday assembling them.

  • Consolidated P&L across every store and period, down to the line
  • Outliers found against trailing-period patterns, not eyeballed
  • Period Review Pack and DM Weekly Playbook delivered on schedule

What it changesPeriod close becomes a review instead of a rebuild.

Back of house

The part of the building nobody walks you through

Three modules sit back here, all reading the same numbers — so the food cost a GM sees on Tuesday is the one that lands in the Director’s period pack.

Lead module

Financial Analytics

One consolidated P&L across every store and period, built the same way each time. When a number looks wrong you open it, rather than reconstruct it.

  • Consolidated P&L across every store and period
  • Drill from the portfolio down to one line on one store
  • Expense outliers surfaced for you, not searched for
  • Period-over-period trends without rebuilding the file

Module

Operations Hub

The daily floor of the business: sales as they land, labor against them, and a forecast set before the schedule is written.

  • Daily sales pulled straight from the POS
  • Machine-learned forecast ready before the week starts
  • Third-party delivery read next to dine-in, not apart
  • Walkthroughs logged from a phone, in the store

Module

Team Accountability

Everyone sees their own scope and nobody argues about whose number is right. The bonus math is the same math on the P&L.

  • GM sees their store, DM their district, Director the portfolio
  • GM bonus tracked against live results, not a month later
  • Labor scorecards by store and by week
  • Walkthrough compliance visible without chasing it

How your data gets here

You do nothing. It runs while the stores are closed.

  1. 01

    Your systems, wherever they are

    POS, payroll, invoices and the delivery apps. Connected once, then left alone.

    POS · Payroll · Invoices · 3P delivery

  2. 02

    Pulled overnight

    Every store, every night, on a schedule. Nobody exports anything.

    01:00 – 04:00, automatic

  3. 03

    Matched and checked

    Lined up to the right store, the right period and the right category, then checked for gaps.

    Store · Period · Category

  4. 04

    Waiting for you by seven

    A refreshed picture, and the period packs and playbooks already sent to the people who need them.

    07:00, every morning

Tuesday morning: pull four exports, rebuild the workbook, hope the periods line up, send it round after lunch.

It was already there at seven.

Who sees what

Same building. Three sets of eyes.

Everyone opens the same platform and sees only the scope they own, and only the numbers they are held to. Nobody is handed a spreadsheet. Nobody sees a store that isn't theirs.

The General Manager sees one store. Theirs.

They open it on a phone in the office before the lunch rush and know where they stand by 10am — not when the period closes.

1 of 126 stores in scope

What they see

  • Today's sales against the forecast
  • Hours run so far versus hours earned
  • Their food cost, actual against theoretical
  • Their open walkthrough actions

What they're held to

  • Labor as a percent of sales
  • Food cost variance
  • Walkthrough items closed on time
  • Bonus tracked live, not explained later

Cannot see: any other store's P&L, district payroll, or portfolio numbers.

The District Manager sees their district. All of it, ranked.

One screen tells them which store to drive to on Tuesday, and what to walk in holding.

11 of 126 stores in scope

What they see

  • District roll-up, period to date
  • Their stores ranked on labor and food cost
  • Forecast accuracy store by store
  • Who has scheduled against the forecast, and who hasn't

What they're held to

  • District labor percent
  • Period P&L against plan
  • Walkthrough compliance across the district
  • Coaching actions closed, not just logged

Cannot see: other districts, or anything above their line.

The Director sees the whole portfolio, on one page.

Every district side by side, in the same period, on the same definitions — so the conversation is about causes, not about whose spreadsheet is right.

126 of 126 stores in scope

What they see

  • Consolidated P&L, every store and every period
  • All 11 districts compared on the same lines
  • Expense outliers surfaced against trailing periods
  • Forecast accuracy across the group

What they're held to

  • Portfolio margin against plan
  • Controllable spend per store
  • Whether the DMs below them are actually closing the gap
  • The number the owner asks about

Access is set once by role. Adding a store or moving a district updates every view underneath it.

Figures shown are representative and illustrative, not client data.

Also in the box

Built for the way the field actually works

  • Mobile-first for the field

    Managers are standing on a line, not sitting at a desk. Every view is built for a phone held in one hand.

  • Sales forecast before the week starts

    A machine-learned forecast per store, per day, so labor is scheduled against demand rather than against last year.

  • Your brand, not ours

    White-label colours, logo and report styling, so what your managers open looks like it came from your office.

  • Daily POS sync, unattended

    Sales, labor and delivery data pull themselves in every morning. No one exports anything, no one re-keys anything.

Reports

The pack is already on the desk.

Nobody ran it. Three documents build themselves the moment the numbers close, formatted like something a person made, and land in the right inbox on a schedule you set once.

A dashboard waits to be opened. These do not wait.

  1. PERIOD REVIEW PACK P08

    Period Review Pack

    EVERY PERIOD

    each District Manager

    One PDF per store: P&L performance, guest feedback scores, food cost actual against theoretical, and the labor history behind both. Built the morning the period closes, so the conversation happens while it still matters.

  2. DM WEEKLY PLAYBOOK WK 34

    DM Weekly Playbook

    EVERY MONDAY

    every DM, before the week starts

    The week on one page: sales targets by store, labor compliance, how close last week's forecast landed, and which walkthroughs are due. Laid out for a phone, because that is where it actually gets read.

  3. EXPENSE OUTLIERS PORTFOLIO

    Expense Outlier Analysis

    MONTHLY

    Directors and whoever signs the invoices

    Every controllable line held against its own trailing periods, across every store. Anything that has quietly drifted comes back flagged, ranked by what it is costing you, and formatted to forward straight to the vendor.

Set the schedule once. After that it arrives written, formatted and addressed — no analyst, no reminder, no one chasing a spreadsheet on a Friday.

Figures shown are illustrative.

End of the walk

You just walked one store. Tomorrow morning, walk all of them.

Every building you run, read the same way at the same hour: sales, food cost, labor, and the expenses that quietly drift. You stop finding out at period close.